 Several different weighting systems are used for several different purposes.
If you don't watch your sound dosage, you might become hard of hearing. Research now shows that exposure to excessive sound, not aging, makes people lose their hearing.
NOTE: See:
Look for the following symptoms of hearing damage:
Introductory:
|
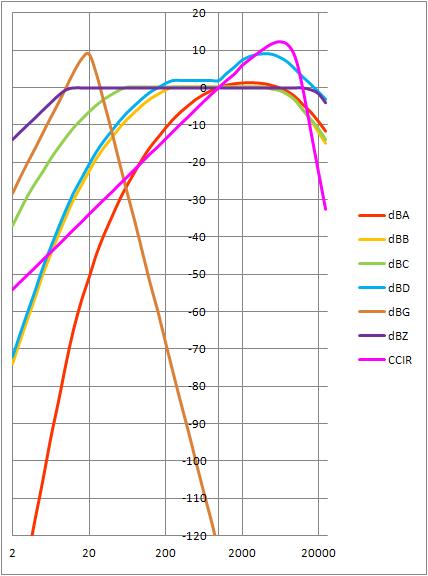
WEIGHTINGS
Selecting the correct weighting It is important to use the correct weighting for the sound levels being measured. Each weighting is valid only inside the specified range. Attempting to use a weighting outside its range gives erroneous readings. Such false readings cause the readings to be higher or lower than the real SPL levels. Use the correct weighting. If it is available, get a dBZ reading first. Then take a dBC reading. If the dBZ reading is larger than the dBC reading, use dBZ. Otherwise use the dBC reading to choose dBC, dBB, or dBA from the list above. |
||||||||||||||||||||||||||||||
|
Many otologists think the weighting curves should be adjusted to add sounds which are not perceived as loud, but which do cause hearing damage. The new Z weighting satisfies this. Sounds below 20 Hz are not even represented in the A, B, or C weighting curves, because most ears do not sense them as sounds. But enough acoustical energy in the infrasonic area can cause pain, and can cause hearing loss beginning in the 3 KHz area in some individuals. Even the Z weighting does not cover infrasound adequately. The level can be estimated if the infrasound is present alone. Use this procedure:
|
Many SPL meters do not have a B weighting selection (The ISO stupidly discontinued the standard). If a sound falls within the B weighting range, it can be measured with this procedure:
Most SPL meters do not have a Z weighting selection. If a Z weighting us needed, it can be estimated with this procedure:
|
||||||||||||||||||||||||||||||
The OSHA RegulationThe OSHA (Occupational Safety and Health Administration) guidelines for sound exposure say that workers may be exposed to the following levels of sound pressure (SPL) for the following time periods (but only ONE of these levels in any 24 hour period). In addition, hearing protection is required to be available at any level above 85 dB SPL. Many otologists feel that the OSHA guidelines do not provide enough protection. (See below for the otology-recommended NIOSH scale.) Use the dBZ scale if available. Otherwise use dBC. A formula for calculating these times (using an ordinary scientific calculator or a spreadsheet) follows: OSHA max time (hr):
|
OSHA
OSHA permitted exposure times |
||||||||||||||||||||||||||||||
The NIOSH-ANSI RecommendationNIOSH (National Institute for Occupational Safety and Health) and ANSI (American National Standards Institute) have adopted a stricter standard based on equal amounts of energy. Here is their scale of the amount of sound a person may be exposed to in a 24 hour period: Use the dBZ scale if available. Otherwise use dBC. A formula for calculating these times follows: NIOSH max time (hr):
|
NIOSH-ANSI
NIOSH recommended maximum exposure times |
||||||||||||||||||||||||||||||
The EPA RecommendationEPA (Environmental Protection Agency) has adopted a yet stricter standard based on equal amounts of energy. But it seems to be based on removing annoyances, rather than hearing protection, since no person in the audience of a concert could hear the music. Here is their scale of the amount of sound a person may be exposed to in a 24 hour period: Use the dBZ scale if available. Otherwise use dBC, or dBB if the dBC reading is below 85 dB. A formula for calculating these times follows: EPA max time (hr):
|
EPA
EPA recommended maximum exposure times |
||||||||||||||||||||||||||||||
| LEVEL | OSHA MAX TIME | NIOSH MAX TIME | EPA MAX TIME |
|---|---|---|---|
| > 115 dB SPL | NONE | NONE | NONE |
| 115 dB SPL | 15 minutes | 28 seconds | NONE |
| 112 dB SPL | 22 minutes 45 seconds | 56 seconds | NONE |
| 109 dB SPL | 34 minutes 28 seconds | 1 minute 52 seconds | NONE |
| 106 dB SPL | 47 minutes 38 seconds | 3 minutes 45 seconds | NONE |
| 103 dB SPL | 1 hour 20 minutes | 7 minutes 30 seconds | NONE |
| 100 dB SPL | 2 hours | 15 minutes | NONE |
| 97 dB SPL | 3 Hours | 30 minutes | 3 minutes |
| 94 dB SPL | 4 hours 36 minutes | 1 hour | 6 minutes |
| 91 dB SPL | 7 hours | 2 hours | 11 minutes 15 seconds |
| 88 dB SPL | 10 hours 30 minutes | 4 hours | 22 minutes 30 seconds |
| 85 dB SPL | 16 hours (protection) | 8 hours | 45 minutes |
| 82 dB SPL | 24 hours (continuous) | 16 hours | 1 hour 30 minutes |
| 79 dB SPL | 24 hours (continuous) | 24 hours (continuous) | 3 hours |
| 76 dB SPL | 24 hours (continuous) | 24 hours (continuous) | 6 hours |
| 73 dB SPL | 24 hours (continuous) | 24 hours (continuous) | 12 hours |
| 70 dB SPL | 24 hours (continuous) | 24 hours (continuous) | 24 hours (continuous) |
Comparison between the standards
Now, how do you figure out your exposure if you are exposed to different levels of these sounds for different periods of time?
Here is one way to calculate your total dose to damaging sound (using the NIOSH levels):
Note: If your equipment gives you the peak level, average level, and minimum level for a given period, calculate the dosage for each figure for the period, and then average the three dosages found. DO NOT average the dB SPL levels.
Note: If you know only the peak level, you must use that. If you know only an average level, add a 10 dB safety margin to it.
|
Example: You are exposed to: 91 dB SPL - 1 hour Is your total dose too large? A spreadsheet is ideal for figuring these doses. Using the same example:
Spreadsheet for figuring NIOSH doses |
Manually calculating NIOSH doses: dose1 = 1 * 2 ^ ((91 - 94) / 3) dose2 = 3 * 2 ^ ((88 - 94) / 3) dose3 = 4 * 2 ^ ((85 - 94) / 3) Sum the doses: This is larger than 1, so there is a very large chance of damaging hearing. |
Recent research has indicated two new facts about hearing loss:
Age related hearing loss is now thought to not exist. Instead, what was thought to be age-related hearing loss has now been found to be acquired hearing loss from cumulative exposures to the loud sounds of steam trains, firearms, and factories.
Extremely low frequency sounds do not follow the tables above, because the weighting curves used for the sound measurements above are based on audibility. But it is now thought that frequencies under 60 Hz, and especially those approaching DC impulse transients, cause hearing damage, even though they are not very audible. This damage begins in the "rock range", starting between 2 KHz and 6 KHz, and expanding in frequency range as exposure continues. So the following precautions should be taken:
Links:
Several different weighting systems are used for several different purposes.
The chart is repeated so it can be seen without much scrolling.
The following list shows the correct weighting for each use:
NEVER use the A weighting to evaluate whether a hazard to hearing exists.
Uses:
NEVER use the B weighting to evaluate whether a hazard to hearing exists.
Uses:
NEVER use the C weighting to evaluate whether bass notes are a hazard to hearing.
Uses:
D Weighting (dBD):
NEVER use the D weighting to evaluate whether a hazard to hearing exists.
Uses:
NEVER use the G weighting to evaluate whether a hazard to hearing exists.
Uses:
ALWAYS use the Z weighting to evaluate whether a hazard to hearing exists.
Uses:
NEVER use CCIR 468 weighting to evaluate whether a hazard to hearing exists.
Uses:
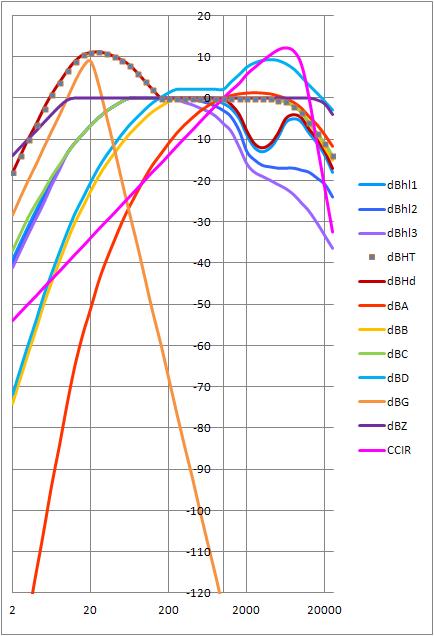
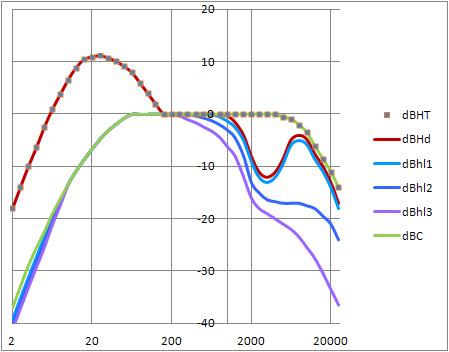 There are several mechanisms of hearing loss. The curves show the effect on hearing from each one:
Notice the dip in the response near 3 KHz caused by damage from excessive sound pressure. The hair cells in the cochlea in the 3 KHz area are those most susceptible to damage from loud bass notes.
Notice the wider dip in the response near 3 KHz caused by more damage from excessive sound pressure. The hair cells in the cochlea are damaged over a larger area.
Notice the even wider dip in the response near 3 KHz caused by even more damage from extensive sound pressure. The hair cells in the cochlea are damaged over a much larger area.
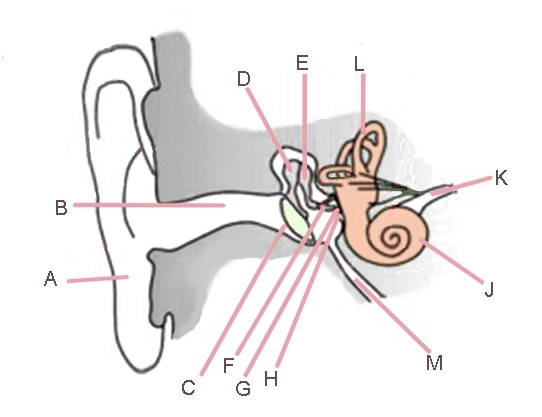
 There is a little bypass port at the end of the spiral of the cochlea called the helicotrema. Its
job is to equalize pressure between the chambers in the cochlea. It also lets frequencies below
15 Hz bypass the membranes of the cochlea. Under normal circumstances, the ear is not sensitive to
frequencies less than 15 Hz because the helicotrema lets them bypass the sound-sensitive cells.
There is a little bypass port at the end of the spiral of the cochlea called the helicotrema. Its
job is to equalize pressure between the chambers in the cochlea. It also lets frequencies below
15 Hz bypass the membranes of the cochlea. Under normal circumstances, the ear is not sensitive to
frequencies less than 15 Hz because the helicotrema lets them bypass the sound-sensitive cells.
In a person with stenosis of the helicotrema, this bypass port is either greatly narrowed or it is completely closed. So the very low tones (below 70 Hz) have no place to go but to be reflected back into the cochlea. This has these effects:
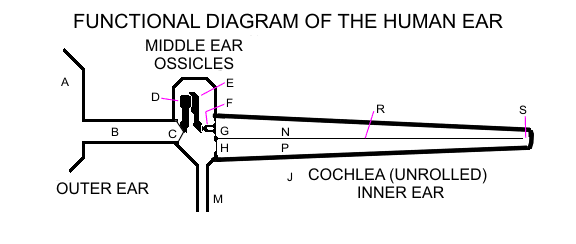
THE STRUCTURE OF THE EARThe path of the sound from the open air to the brain:
How the cochlea sorts sound frequencies:
|
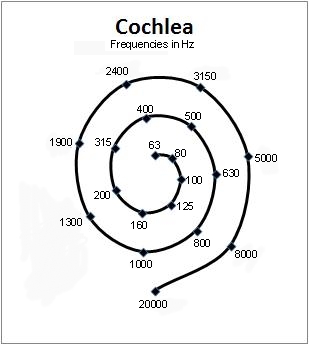
The frequency locations are approximate, since various people's cochleas are made differently. |
Notes on the structure and function of the ear:
Links: