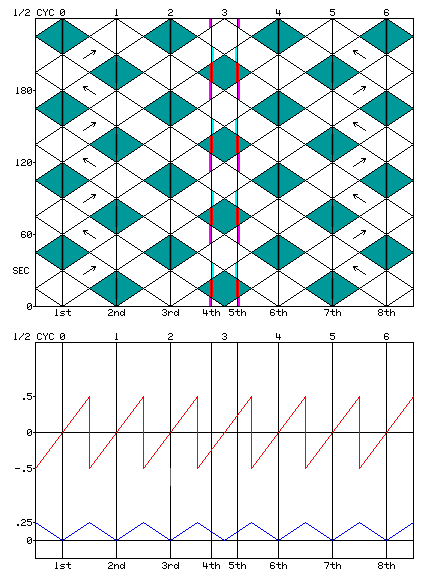
The upper chart at right is a time-space diagram used to calculate
signal progression on a two-way street.
- The vertical axis is time. Later is upward. Vertical lines are streets.
- The horizontal axis is distance. Street names are on the axis.
- The scale at the top is in half-signal-cycles from 1st street.
- The lower chart shows the distance from ideal progression points.
The colors in the diagram have these meanings:
- White = vehicle motion
- Red = signal is red
- Cyan = leading left turn phase
- Magenta = Lagging left turn phase
Where white areas cross streets, traffic flows if the signal is green:
- Lights turn green with the traffic on 1st, 2nd, 3rd, 6th, 7th, and 8th streets.
- On 4th and 5th streets, lead-lag turn phases provide progression.
Are permissive turns allowed with lead-lag turn phases?
- Left turn on circular green causes yellow trap (previous page).
- One solution is to stop left turns with red arrows (no permissive turns).
- Flashing yellow arrows allow lead-lag with permissive turns.
- Flashing yellow arrows prevent lead-lag yellow trap (previous page).